- US: +1-408-610-2300
- Toll Free: +1-866-831-4085
- Become a Client
The global smart demand response market size was worth USD 5.57 billion in the year 2014. Technological advancements in the utilities vertical along with the implementation of regulations are anticipated to increase the deployment of the smart grid which will further boost the market growth.
The increasing smart grid roll-outs increase the integration of renewable energy, consumer energy management systems, automation in transmission, and distribution (T&D) system. Advantageous policies and favorable demand response are further likely to augment revenue by 2025. For example, the U.S. Green Building Council announced the launch of a LEED DP Pilot project for motivating demand response participation by enabling the building owners to acquire additional LEED credits for implementing fully automated solutions.
Advanced ICT DSM solutions coupled with intelligent metering for energy management in buildings are observed as a lucrative opportunity to allocate renewable energy sources, save energy, and further motivate consumers’ involvement in the ecosystem.
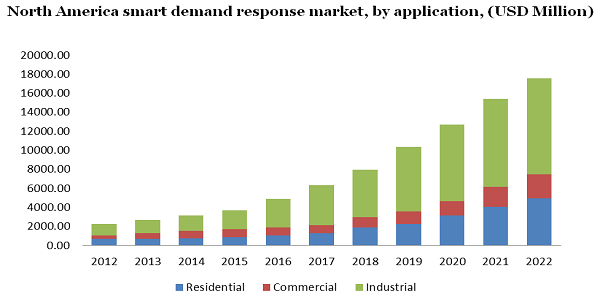
DR programs need a direct load monitor of the higher application for residential customers at home6, which includes pool pumps, air conditioning systems, and hot water heaters. Increasing adoption of distributed generation, especially from the household consumers aids in enhancing the DR potential.
Intelligent buildings are anticipated to engage in DR programs for the safeguarding of the electrical grid at the time of high energy demand. Minimizing load when desired is likely to minimize electricity bills, thus, being beneficial to the customers.
Rising developments for industrial and commercial demand response are due to the increasing requirement for utilities for the management of high requirements and in the hardware technology which consists of metering and control equipment.
The Asia Pacific held a share of above 15% of the overall revenue in 2014 owing to the increasing use of smart meters in this region. The growth of the meters enables the houses to connect to the data on price and usage. Electricity pricing options based on time which are used by the mass rollouts of these meters are further anticipated to create opportunities for regional growth.
North America held around 60% of the overall share in 2014. Buildings, in California, are predicted to put up to the highest peak batch. The Demand Response Research Center (DRCC) emphasizes residential and commercial applications of the technologies for effective peak load decline with various response time spans.
The key players like Schneider Electric provide solutions for electric usage. For example, Schneider Electric, in December 2015, announced the launch of a Wi-Fi thermostat. The Wiser Air thermostat is incorporated with ZigBee to cohort smart meters and other home devices.
The DR program assists in improving control, distribution, monitoring, and optimization through the supply of Virtual Power Plants. ABB, in December 2015, announced the insertion of 363 kilovolts which loses the circuit breaker coupled with Fiber Optic Current Sensor, thus, combining three substations like current measurement, circuit-breaking into a single component, and current measurement, thus, lowering the speed required for a substation.
Honeywell, in May 2015, announced the usage of Open ADR 2.0b, the advanced version of the open standard created in the U.S. to facilitate utilities and DR aggregators to contact the networked building control systems.
|
Attribute |
Details |
|
The base year for estimation |
2014 |
|
Actual estimates/Historical data |
2012 - 2013 |
|
Forecast period |
2015 - 2022 |
|
Market representation |
Revenue in USD Billion & CAGR from 2012 to 2022 |
|
Regional scope |
North America, Europe, Asia Pacific, Latin America, and Middle East & Africa |
|
Country Scope |
U.S., Canada, UK, Germany, China, India, Japan |
|
Report coverage |
Revenue forecast, company share, competitive landscape, and growth factors and trends |
|
15% free customization scope (equivalent to 5 analyst working days) |
If you need specific information, which is not currently within the scope of the report, we will provide it to you as a part of the customization |
This report forecasts revenue growth at global, regional, and country levels and provides an analysis of the latest industry trends in each of the sub-segments from 2012 to 2022. For the purpose of this study, Million Insights has segmented the global smart demand response market based on application, and regions:
• Application Outlook (Revenue, USD Billion, 2012 - 2022)
• Residential
• Commercial
• Industrial
• Regional Outlook (Revenue, USD Billion, 2012 - 2022)
• North America
• U.S.
• Canada
• Europe
• Germany
• UK
• the Asia Pacific
• China
• India
• Japan
• Latin America
• MEA

Research Support Specialist, USA